Fluorescence Resonance Energy Transfer
From SMOSwiki
Introduction
Fluorescence Resonance Energy Transfer (FRET) is an energy transfer process between the fluorescent dye molecules [1]. Due to its high sensitivity to the change of distance between the dyes, it has received great interest for the study of biological systems [2]. FRET technique has a spatial resolution of sub-nanometer, and can be used as a probe of inter- and intra-molecular dynamics of biological macromolecules such as protein conformational change, enzyme-substrate reaction, and RNA folding [3][4]. Determination of FRET efficiency in ensemble measurement is, however, not straightforward due to the difficulty in distinguishing FRET pairs from unpaired dyes or the dyes not properly labeled to the bio-molecule in question that might give huge background [5]. By contrast, single-molecule detection provides a method that is free from this obstacle as it can only collect the signal from one single FRET pair. Another advantage of this technique is that it allows monitoring the structural- or conformation change of single molecule in situ [6]. We use confocal microscopy and total internal reflection microscopy (TIRF) for single-molecule detection of FRET from a dye-pair to investigate biological macro molecules.
Theoritical basis
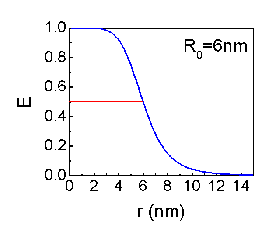
FRET was first introduced by Theodor Förster in 1948. The energy transfer efficiency between two adjacent fluorescent dye molecules is given by
- E=1/(1+(r/R0)6)
, where r is the distance between the dyes and R0 is the distance of which the E became 0.5.
- R0=9Q0(ln10)κ2J/128π5n4NA
Here, Q0 is the fluorescence quantum yield of the donor molecule, κ is the dipole orientation factor, n is the refractive index of the medium, NA is Avogadro's number, and J is the spectral overlap of the donor and acceptor.
R0 varies with fluorescent dye molecules and usually have a value of a few nanometers.
Experimentally, FRET efficiency can be determined by the fluorescence intensity ratio.
- E=FA/(FA+FD)
Here, FD and FA are the fluorescence intensity of the donor and acceptor dye molecule.
Experimental scheme
To realize the single-molecule FRET measurement, total internal reflection microscopy (TIR microscopy)or confocal microscopy is used to get high signal to noise ratio. Molecules fluorescent labeled are immobilized on the quarts slide surface with very low density so that each individual molecules can be separately imaged by TIR or confocal microscopy. Fluorescence from the single FRET pair is spectrally divided into donor and acceptor signal by a dichroic mirror and recorded simultaneously either by CCD camera or avalanche photodiode (APD). The advantage of use of TIR microscopy is simultaneous measurement of hundreds of FRET pairs at a time. The advantage of confocal setup is its fast time resolution, typically µs, but ultimate time limit is governed by photophysics of labeling dyes.
Current works
Currently, we are working on two project with single-molecule FRET. (For the details see Macro biomolecules)
RecA filament dynamics
RecA is a protein which is involved in several DNA repair pathways s.a. homologous recombination and SOS response. RecA forms a right handed helical filament on a single-strand DNA, so that the DNA can be stretched out allowing the homologous sequence searching. We use single-molecule FRET technique to observe the formation and growth of RecA filament in real-time. we could resolve the monomer binding and dissociation from the filament and get the kinetic rate under various chemical conditions.
DNA bubble and fork formation
DNA has a double-helical structure with two complimentary strand. In the solution, however, partial unwinding of double-strand DNA occurs spontaneously by thermal (or quantum) fluctuation, which is called DNA bubble and fork formation. As FRET is sensitive to the distance change in nanometer scale, we study the DNA bubble and fork formation in real time.
References:
- ↑ T. Forster, Ann. Phys., 2, 55 (1948).
- ↑ P. V. Cornish, and T. Ha, ACS Chem. Biol. 2, 53 (2007).
- ↑ T. Ha, Biochemistry 43, 4055 (2004).
- ↑ X. Zhuang, Annu. Rev. Biophys. Biomole. Strut. 34, 399 (2005).
- ↑ G. W. Gordon, G. Berry, X. H. Liang, B. Levine, and B. Herman, Biophys. J. 74, 2702 (1998).
- ↑ T. Mori, R. D. Vale, and M. Tomishige, Nature 450, 750 (2007).


