Fluorescence Correlation Spectroscopy
From SMOSwiki
Contents |
Fluorescence Correlation Spectroscopy (FCS)
Fluorescence correlation spectroscopy (FCS) is a powerful tool to investigate particles diffusing in solution. It has been widely used in chemistry and biology since its first introduction in early 1970s. [1] During the 1990’s FCS took on a new aspect with the advances in single photon detection technique and high resolution confocal microscopy. [2] Confocal microscopy provides small confocal detection volume (~1 femtoliter) and good signal to background ratio enough to perform the FCS in single molecule detection. The fluorescence fluctuation is auto- and cross-correlated to quantify the temporal behavior of the molecules freely defusing in and out of the focal volume by which diffusion coefficient and concentration could be extracted out. As the technique is very sensitive to the concentration and the diffusion coefficient of the solute molecule, it would be suitable to study the interaction or aggregation of macro bio-molecules in solution. [3]
Setup
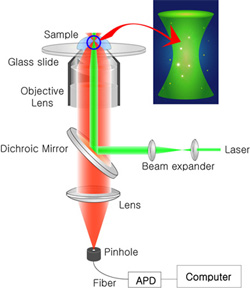
FCS technique is based on confocal microscopy (see the figure right). As a excitation source, laser light is sent through the objective lens to make a tiny focal volume (~1 fl). Fluorescence from the focal volume is collected by the same objective lens and separated by a dichroic mirror. A confocal pinhole is located to remove the background from out-of-focus region. In the detection part, detectors of high quantum yield (s.a. avalanche photo diode) should be used, and the measured fluctuation of fluorescence signal is analyzed by either software or hardware.
Correlation analysis
Measured fluorescence fluctuation contains temporal information of fluorescent dye freely diffusing in and out of the confocal volume. The correlation analysis is used for extract out the useful physical parameters s.a. diffusion coefficient. A correlation function G(τ) is defined by
- G(τ) = <F(0)*F(τ)> / <F(0)>2
, where F(t) is the measured fluorescence. By assuming that the confocal volume has 3-dim gaussian form, we can relate the correlation function with diffusion coefficient D.
- G(τ) = N-1 * (1+4*D*τ/r0)-1 * (1+4*D*τ/z0)-1/2
, where r0 and z0 are lateral and axial radius of the confocal volume, respectively, and N is the average number of fluorescent dye molecules.
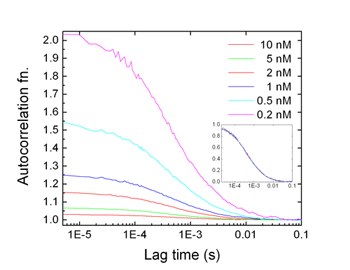
Please note that the correlation function is inversely proportional to the concentration of fluorescent dye molecules, while the overall shape of the function does not change, which is determined by diffusion coefficient. Thus, we can accurately measure the concentration of dye molecules as well as the diffusion coefficient.
Additionally, in principle, any physical parameters generating fluorescence fluctuation can be measured with high accuracy in single molecule level. (Ex. triplet state of dye molecule, photo-isomerization)
Example : DNA-protein binding
References:
- ↑ D. Magde, E. L. Elson, and W. W. Webb, “Thermodynamic Fluctuations in a Reacting System-Measurement by Fluorescence Correlation Spectroscopy,” Phys. Rev. Lett. 29, 705 (1972); E. L. Elson, D. Magde, “Fluorescence Correlation Spectroscopy. I. Conceptural Basis and Theory,” Biopolymers 13, 1 (1974); S. T. Hess, S. Huang, A. A. Heikal, and W. W. Webb, “Biological and Chemical Applications of Fluorescence Correlation Spectroscopy: A Review,” Biochemistry 41, 697 (2002).
- ↑ M. Eigen, and R. Rigler, “Sorting single molecules: Application to diagnostics and evolutionary biotechnology,” Proc. Natl. Acad. Sci. U.S.A. 91, 5740 (1994); S. Maiti, U. Haupts, and W. W. Webb, ” Fluorescence correlation spectroscopy: Diagnostics for sparse molecules,” Proc. Natl. Acad. Sci. U.S.A. 94, 11753 (1997).
- ↑ K. Garai *, R. Sureka, and S. Maiti, “Detecting Amyloid-ß Aggregation with Fiber-Based Fluorescence Correlation Spectroscopy,” Biophysical Journal 92, L55 (2007).


